This is the second part of the blog post where we summarize our experience at Kafka Summit London and highlight the key takeaways of our favorite talks regarding Kafka ops and monitoring. Here you can read the first part of this post, where we tell our thoughts regarding Kafka pipeline and streaming at the Kafka Summit London 2018.
Monitor Kafka Like a Pro – Gwen Shapira, Xavier Léauté – confluent
Kafka is great for building data pipelines but, when it comes to monitoring, ops end up lost and do not know exactly what to check.
During broker updates, you must be extra careful. Kafka brokers are backward compatible with the previous version of the protocol. This is useful for rolling upgrades; however, it has the consequence of generating some additional load on the brokers for message conversion. If your brokers’ heap is too small, this can generate some OutOfMemory errors. Thankfully, with Confluent Command Center, you do not have to worry about this.
It checks a bunch of metrics for you:
- ISR shrinks and expands per sec
- Under-replicated partitions
- Overloaded network threads
- Overloaded request processor thread
Keep Kafka broker logs as INFO even if this generates a lot of them. During critical operations it is always good to have some of the context:
- Collect Kafka broker logs
- Read stack traces
- Collect JMX metrics
- Turn on heap dump on crashes
Concerning consumer application, you would like to monitor consumer lag, partition assignment, partition skew, client logs, GC client logs, request latencies, commit rates, group rebalancing. You may tune batch size and commit rate to better suit your needs and performances. In addition, never forget to use a profiler to analyze your application in running state. Async Java Profiler is a good solution. You can then draw flame graphs and check the behavior of your application. Launch your JVM with -XX+PreserveFramePointer to do this.
Typically, as a rule of thumb, you would like to size your batch to less than 10MB in order to keep GC low. However, be careful to not commit too often; otherwise, you might end up with poor performance and/or overload your brokers. This way your application will not lag too much and have optimum performance. Offset commits are expensive so avoid doing them on each message.
For a constantly rebalancing consumer group, it might be a symptom of either:
- low throughput
- high network chatter
- no progress
- hanging
- timing issues
- long GC pauses
- infrequent calls to poll()
- timeout too short
- flaky network
What to watch:
- join-rate
- sync-rate
- consumer lag in messages and in seconds
Whether you spot some performance issues on Kafka brokers, producers or consumers, after tuning your applications and servers, you might need to tune your operating system as well. Kafka can handle high latency network if the system is correctly adjusted. Nowadays, servers have more RAM and CPU available, so do not hesitate to increase kernel network buffer size.
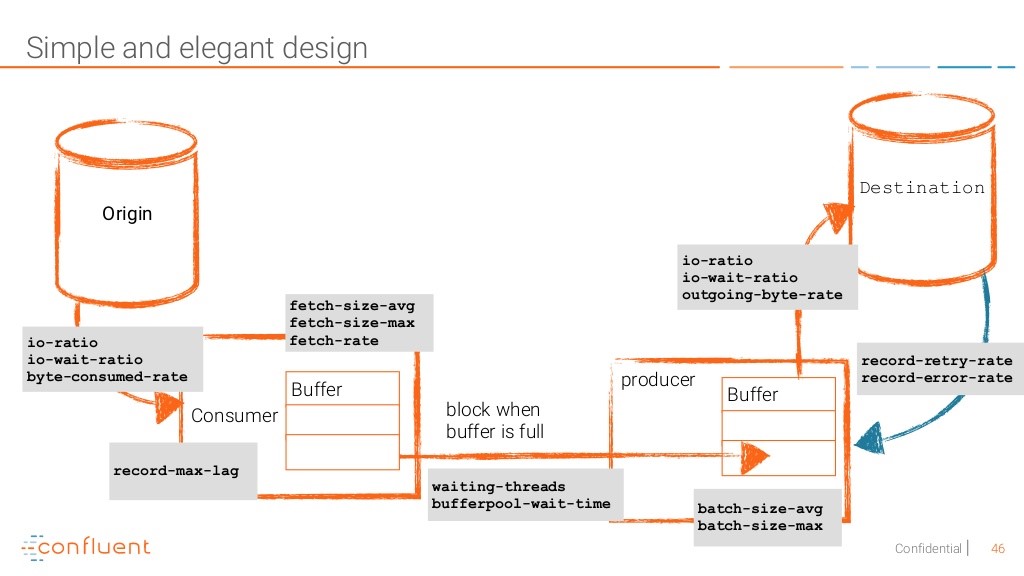
To sum up, here is a diagram of what to monitor
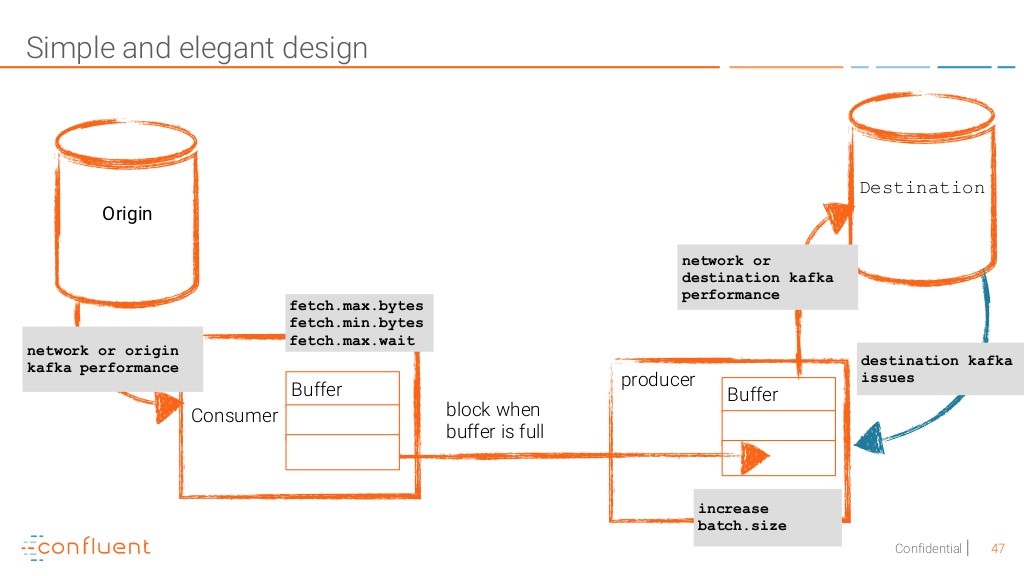
And here is what to tune to achieve better performance and stability on your Kafka infrastructure
Finally, read the docs! You will find lots of tips and tricks and have better understanding of all configuration settings available to you.
In this talk Eric and Andrew explain their methodologies and benchmarks made to find the “price-performance sweet spot” for IBM Kafka platforms. IBM uses Kafka for two of their services: one is IBM message Hub, a Kafka As A Service solution, another is IBM IoT platform.
Running with bare-metal brokers is great for performance but too expensive. On the other hand, choosing small VM is cost-effective and allows for a massive reduction of people supporting the platform; however, low IOPs disks can be a pain with Kafka. IBM chooses a trade-off with the use of powerful VM with network attached storage to allow to easily kill VM without fearing data loss. In addition to choosing number of CPU or RAM for brokers, they focus their efforts on the storage part and compare different solutions like network file storage or block storage to see how they fit with Kafka. They ultimately chose a best class iSCSI block storage for their Kafka infrastructure.
Another challenge to achieving high partition density is the significant effect on throughput and latency as the partition number per broker increases to numbers like 1 000, 5 000 or 10 000 partitions per broker (more details about potential issues with high partition density in this page). Therefore, IBM’s approach was to define throughput and latency SLA, to create some monitoring and alerting based on it, and to use it as an adjustment variable to define the number of VM required per cluster.
To quote the speaker, “bare metals servers are like pets” — you need to take care of it. It’s true and even if, at Criteo, for performance purposes, we are only using bare-metal servers for Kafka, the talk gave us a lot of insight about metrics and issues we need to focus on if, one day, we want to deploy some Kafka clusters in PaaS like Mesos or in the cloud.
URP? Excuse You! The Three Metrics You Have to Know – Todd Palino – LinkedIn
Todd Palino, Kafka SRE at LinkedIn (and one of the author of the book Kafka: The Definitive Guide) explains to us what the LinkedIn journey for Kafka alerting was. First, if you read Kafka literature or blog posts, you will figure out alerting can be based on these specific JMX metrics:
- Under-replicated partition (URP) to detect issues with availability or consistency
- Request handler thread pool use to get an overall picture of the broker utilization
- Request timing (total, local, queue or remote time) to get indicators about how long requests are taking
For Todd, these metrics are great for monitoring — so you need to collect and analyze them — but you cannot base your SLA and all your alerting system on them! Metrics can be noisy, volatile or sometime not actionable or difficult to interpret.
Therefore, LinkedIn’s Kafka SLA and alerting system is based on Black box monitoring, and they create and open-source their own tool called Kafka-monitor (github). Kafka-monitor uses a dedicated topic in the cluster to monitor the send and consume of monitoring data and then exposes metrics as latency, message loss, produce rate that you can then easily match with your SLA.
Todd clearly knows his stuff, and this talk was a great opportunity to compare our alerting system with that of LinkedIn. We figured out that, at Criteo, we also use a similar approach of black box monitoring, with the difference that, at Criteo, we send our monitoring message every second in all partitions of a cluster (so monitoring messages are mixed with business data and we need to filter them out during processing), whereas LinkedIn seems to send monitoring messages in a dedicated topic and make sure each broker has at least one partition leader of this topic to be sure to get metrics from all brokers.
Here you can read the first part of this post, where we summarize the talks regarding Kafka pipeline and streaming at the Kafka Summit London 2018.
Post written by:
 |
| Mathieu Chataigner – Staff DevOps Engineer Hervé Rivière – Snr DevOps Engineer Ricardo Paiva – DevOps Engineer |
-
CriteoLabs

Our lovely Community Manager / Event Manager is updating you about what's happening at Criteo Labs.
See DevOps Engineer roles


