When you are dealing with large memory dumps, figuring out what instances of which types (i.e. the list of types sorted by size of their instances with their count) are stored in memory takes time. Sos in WinDBG provides the dumpheap -stat command that can take minutes. For example, on a 16.7 GB production dump, the command takes 3’44” in WinDBG and 3’14” in WinDBG 10. During investigations, you don’t want to waste minutes just to have a synthetic view of the .NET heap content. A Twitter discussion around that topic with @tamir_dresher collided with the researches we are doing at Criteo and this post shows our first results.
When automation comes into play, ClrMD provides the same level of features with a very simple loop:
If you run this simple code on the same dump, it takes 2’06”; already faster than WinDBG+sos!
What are the code performances?
Using dotTrace to analyze the performances of this simple ClrMD implementation gives the following results :
With the details for ReadVirtual:
and
It seems that GetObjectType and GetSize are the main sources of CPU usage.
Looking at the ClrMD implementation of EnumerateObjectAddresses helps to better understand these results. The EnumerateObjectAddresses method is implemented by the DesktopGCHeap class:
That calls its HeapBase base class implementation to iterate on the segments of the heap:
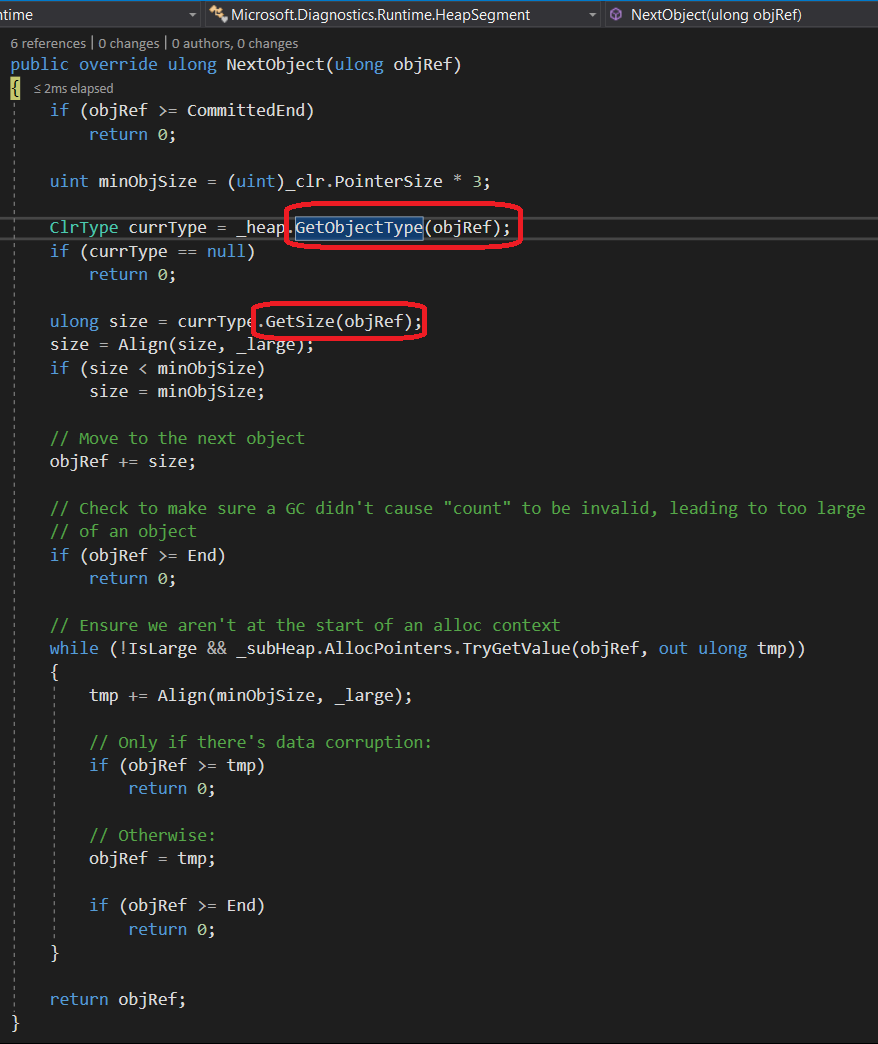
The heavy lifting part of the work is done by the HeapSegment.NextObject method:
It means that in the specific scenario of building a class histogram, the code ends up calling the two very expensive GetObjectType and GetSize methods twice as needed!
Optimize GetObjectType calls
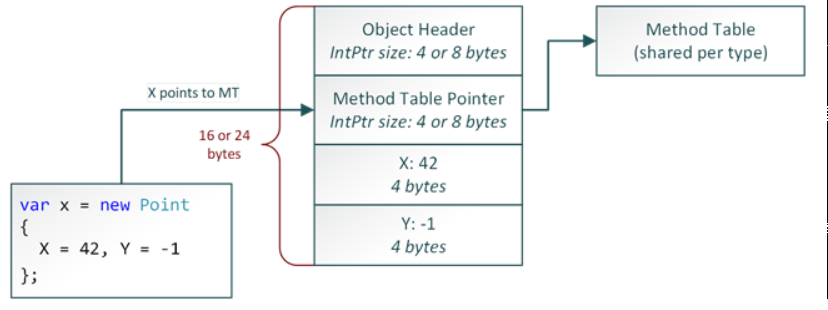
The code in ClrMD relies on the in-memory layout of a reference type instance (see https://blogs.msdn.microsoft.com/seteplia/2017/05/26/managed-object-internals-part-1-layout/ for more details).
It looks for the method table address (i.e. the value pointed to by the object address) and build the ClrType based on the method table content. Even though ClrMD has an internal caching mechanism for the ClrType, it could be efficient to have a cache that returns a ClrType for a given method table address. The next change is to pass the ClrType and size of the current object to the NextObject method, hence avoiding duplicated calls.
The changes in HeapSegment.NextObject are obvious: use the parameters if they are provided:
The execution time for the same 16.7 GB dump is now 1’26” against 3’14″/3’44” for WinDBG+sos: more than 2x faster!
It is possible to add the size to the cache (except for arrays obviously) but it did not bring any value because ClrType.GetSize is already optimized to avoid recomputing the size of an instance when not needed.
If you take a look at the code, you notice that it executes the same code segment after segment. Why not trying to make this shared code run in parallel? Well… in addition to our own Dictionary-based cache, the ClrMD implementation is not thread safe mostly due to caches at multiple levels including the data reader on top of dbgeng that keeps track of a sliding 64 KB page. Without rewriting ClrMD from zero and just adding locks everywhere, the gain is barely visible.
Conclusion
It is hard to understand how it is possible that our ClrMD code could be twice faster than WinDBG+sos.
From Task Manager, the difference is visible at the disk throughput level
The WinDBG+sos code reads ~50 MB/s and the ClrMD code reads 120+ MB/s
Since the code is mostly reading from the dump file, such a huge difference could explain the x 2+ gain we see at execution time.
The corresponding pull request is available on https://github.com/Microsoft/clrmd/pull/121.
Post written by:
|
Christophe Nasarre Staff Software Engineer, R&D. Twitter: chnasarre |
Jean-Philippe Bempel Staff Software Engineer, R&D. Twitter: jpbempel |
-
CriteoLabs

Our lovely Community Manager / Event Manager is updating you about what's happening at Criteo Labs.
See DevOps Engineer roles


