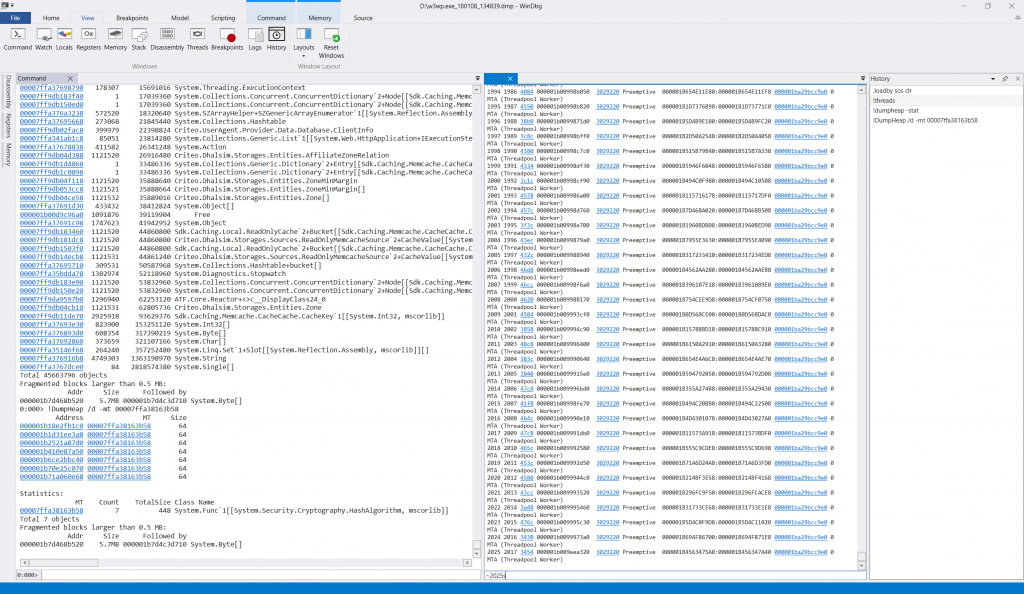
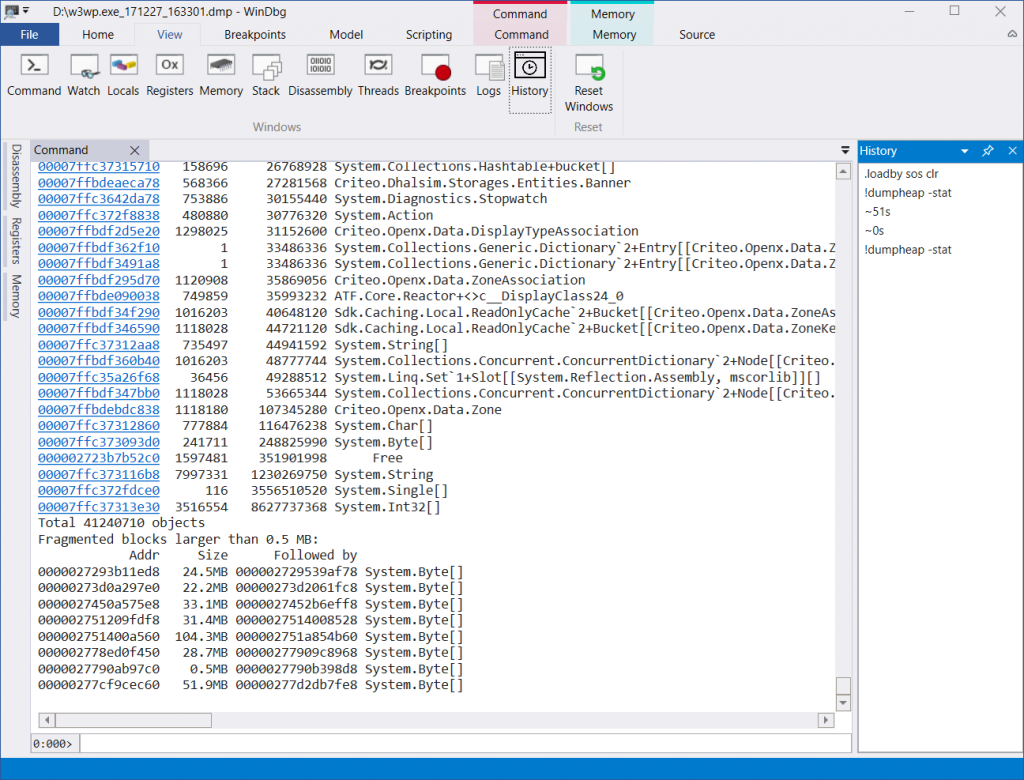
In the first part of the series, we saw how to extend the new WinDbg add a button to the UI, execute, and listen to commands. This time, we will push things a bit farther, and we’re going to add history and multiple editors support. The history feature will allow you to recall an old command without scrolling all the way up or re-executing it (which can be painful when dealing with huge memory dumps).
Note that the code shown on this article is also available on GitHub.
Opening tool windows
First, we need to add a new button to the UI. As we’ve already seen last time how to do that, we’re not going to detail each step.
Nothing new for the button itself:
Then for the viewmodel, the only major difference is that we’re going to put the button in the “View” tab of the ribbon, so we need to change the RibbonTabGroupExtensionMetadata accordingly:
When the user clicks the button, we want to display a tool window that contains the history of typed commands. How to open tool windows? By using the OpenToolWindow method of the IDbgToolWindowManager.
To use it, we first need to import it in our viewmodel:
Then we call OpenToolWindow with the name of the window we want to open:
The CommandHistoryWindow hasn’t been defined yet, so nothing will happen at this point if you click the button. To declare the window, we need to add a class implementing IDbgToolWindow, and decorate it with NamedPartMetadata:
The interface defines a single method, GetToolWindowView, which should return the control to display in the window:
That control will be a classical usercontrol, except that it inherits from ToolWindowView. We also use the ToolWindowView.TabTitle dependency property to set the window title:
Capturing the commands
Now that we have all the components, we still need to capture the commands and their outputs to display them in the history window. We’ve seen last time that we could listen to the commands with the IDbgCommandExecutionListener. For capturing the output, we need to implement the IDbgDmlOutputListener interface, which defines a OnDmlOutput method. That method is directly called with the output of the commands being executed. We have a problem though: the method is called once for every line of the output. How do we know when we reach the end of the output of the command? Unfortunately I couldn’t find any extensibility point that directly provides this information. Still, there is a way.
Ever noticed this little indicator next to the input textbox?
![]()
It indicates the id of the currently selected thread. Whenever you execute a command, it’s appearance changes and it displays “*BUSY*” instead:
![]()
It turns out that we can retrieve that “BUSY” information by implementing the IDbgEngineStatusListener interface with its OnEngineStatusChanged method. Piecing everything together, we’re going to buffer every call to OnDmlOutput, then add the contents of the buffer to the command history when the engine status switches back from “BUSY”. The commands and their output will then be stored in an ObservableCollection, to be displayed in the view.
Then we can update the view to bind the ObservableCollection:
At that point, we have a panel with the list of executed commands:
Nice, but not quite useful. The next step will be to open a new panel window when double clicking a command and display the output.
The custom editor
We’ve already seen how to open a panel window, this time we will be adding a parameter:
The WPF command is bound to the MouseDoubleClick event of the ListBox, and we send the output (Item2 of the Tuple) as parameter:
Like CommandHistoryWindow, CommandWindow implements IDbgToolWindow and exposes a control. We give to the control the parameter we received from OpenToolWindow, as well as an instance of IDbgConsole to be able to execute new commands further on:
In the CommandControl, we set a RichTextBox to display the output of the command, as well as some links when DML is involved (for simplicity sake, we won’t support other DML tags). We also add a simple TextBox to manually execute commands:
In the constructor of CommandControl, we store the IDbgConsole received from the CommandWindow, then we display the output of the command:
Now comes the tedious part: we need to actually write the AppendDmlOutput, which will parse the output of the command to insert links where needed.
First, we add a Paragraph object to the RichTextBox, in which we’ll put the output of the command:
Next, we find all the <exec> tags in the output (they’re the DML tags for hyperlinks), using a regular expression:
For each match, we add a Run which contains the “plain text” output between this match and the previous match. We make sure to call HtmlDecode because the output can contain HTML entities. Then we generate the actual hyperlink and bind it to a custom WPF command:
Finally, we make sure to scroll to the bottom of the RichTextBox. We use the Dispatcher with idle priority to delay the call, because the RichTextBox is rendered asynchronously (if we scroll right away, we may end up at the middle of the output because it wasn’t fully rendered yet):
DmlCommand is a simple WPF command that calls a delegate:
What about the ExecuteCommand method? Inside, we append the name of the command being executed to the RichTextBox. Then we actually execute that command using the IDbgConsole, and call AppendDmlOutput to display the result:
Last but not least, let’s not forget to execute commands manually typed in the textbox:
With that, we’ve seen how to add tool windows to WinDbg, and intercept commands. Of course, the custom editor would need more work, ideally we would re-use the built-in editor but this is much more complex. Let’s hope that Microsoft adds helpers for that in the coming updates. In the next article, we’ll see how to add C# scripting capabilities to WinDbg, to run ClrMD commands directly from the editor.
Post written by:
|
Christophe Nasarre Staff Software Engineer, R&D. |
Kevin Gosse Staff Software Engineer, R&D. Twitter: KooKiz |
-
CriteoLabs

Our lovely Community Manager / Event Manager is updating you about what's happening at Criteo Labs.
See DevOps Engineer roles


