
Over here at Criteo we have a few apps that need to be “real time”. By that we mean we should respond in average below 10ms and never above 60ms. A failure to answer means a missed chance to buy an opportunity to display an ad. Ads are our business, we can’t miss a display. Our app is written in C#, a managed language. With the managed language comes a garbage collector. And a garbage collector seriously impairs the real-timeliness of any application.
But it’s ok. We do timeout for a few requests and the timeout rate is below 0.05%, which is acceptable to us. As we say in French, better is the enemy of good.
And all is well…. until it starts misbehaving.
The problem
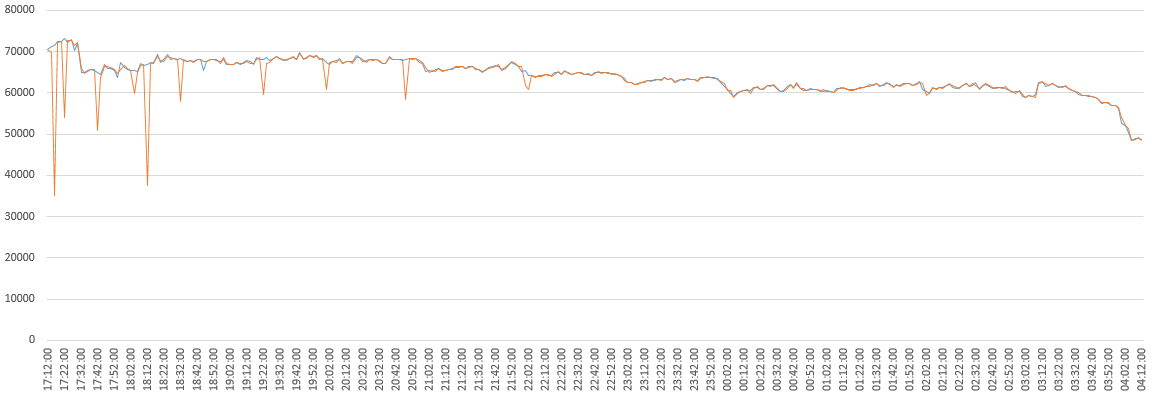
Lately we tried to add yet another feature. For every incoming request, we needed to emit a message with a few key elements of the process that had taken place. It’s an unusual CPU and memory intensive task for us. Each message is on average 4 to 5 KB of JSON (I know, right?), knowing that we process about 1.5k requests per second per server. It all went berserk when we activated it on a test server. All of a sudden, we saw huge drops in incoming traffic. Lots of them. Like, every 10 minutes we would see the traffic divided by two for up to a minute. We tried it sampled at 1% for a few weeks (meaning we would generate the message for 1% of our requests) and that didn’t cause any problem obviously. But 100% was too much. We did set it back to 1% for the time being, while people were working at exploiting the data. This gave us a bit of time to figure out what was going on.

In blue, the traffic of a regular server.
In orange, a server where the feature has been activated at 100%.
This was troublesome. The drop in traffic was quickly explained though. Our clients were believing us to be offline. But why? We know that there is a health check every 2 seconds from our clients. You need to fail it three times to be deemed offline. That looked drastic to us.

The architecture. We are answering RTB and
display requests and we have to choose the right ad.
Fast
The first investigation
We noticed surges of network errors (connection reset) on the clients. Right at the time our test server was being outlived. Did we have a network issue? We also saw a pretty clear correlation to the garbage collector.
In order to figure out which one was causing the other, we dug a little further to see the exact synchronicity of the events. But measuring precisely the beginning of a GC cycle is a bit tricky. And windump gave us plenty of connection resets as well. This was definitely not normal. We balanced our options with Deafening Seb.
So we dug deeper on the network side. The issue was quickly resolved by William the Butcher, and was due to the native queue of the HttpListener. If the managed process doesn’t answer, the underlying network stack is going to buffer activity, in a small 1000 entry buffer by default. It turns out the GC was freezing our process for long enough for this buffer to get filled and the OS would start resetting connections. We raised the limit and connection resets went away.
One problem is gone. The second investigation.
But the main problem remained. Just as bad as before. And the GC was our last lead.
So we started polishing up our WinDbg skills. It was time to optimize our memory allocation frenzy. Several dumps later, we clearly identified a short list of worst offenders.
That’s when BenD kicked in. Benoît loves these stuff. He probably has shares in WinDbg, because he loves it so much it doesn’t look natural. Anyway, he didn’t only find the worst offenders in there, he also found a bunch of email addresses spread around in Strings. All addresses of people working @criteo.com (We stay away from storing identifiable data of our users so it was kind of a relief to find only criteo.com addresses in there). But in any case, why the heck did we have emails of coworkers in memory? We also found 655651 instances of the String “3046”. So we’re all in favor of redundancy, it is not the point, but clearly something could be optimized. BTW, if you have any idea what that could be, send me an email because over here, we’re still wondering.
Anyway, these were just a few MB at worst. Not any game-changer findings.
Let’s get back to the game-changers. Luckily, one of them was already in our backlog to be tackled. It was an old migration that was halfway through. We replaced our old DAL (Data Access Layer) with the new all-powerfull DHALSIM (Data Handy Access Layer with Simple Injection Model). We had to find an acronym because one of our team members was vetoing any stupid name with no meaning. Hi Camille. The old datasource was still plugged in but the new API was being used. This resulted in us caching the old version of the data object, converting it on the fly at every request.

As you can see on the performance monitor, at the exact time we got outlived,
the Gen1 size surges and most of the time is spent in GC, for almost 20 seconds!

Dhalsim, the father of Dat(t)a
Performance tests
First, let’s devise some tests to see if tackling the worst offenders makes the new feature work . We devised a few dirty hacks to remove them and we stressed one of our servers on our preprod environment. No matter what we did, no matter which one of the worst offender we “disabled” or optimized, the symptoms stayed the same. We tried warming up our preprod server for a few minutes but alas, nothing changed. We tried replacing the JSON generation with protobuf serialization (Migration is underway) and the problem remained as bad as before. We tried not sending the message generated, avoiding a couple of byte arrays creations. Nothing moved. Baffled we were.
In the meantime, one of our worst offender fix was released. We ran another test in prod to see what was going on. We observed exactly the same symptoms. We were getting outlived by our clients at about the same rate. We decided to let the server run for 24 hours at that rate. The next day we observed the problem got away. It took about 12 hours, but it eventually went away. This was news!
The weird thing is that the symptoms were the same, but they did not last as long as before. Very practical. To see if you’ve made progress, you need to wait for 12 hours of live traffic. Talk about being agile.
That said, we have had a warmup issue for a while and we were already aware of it. But it didn’t really cause any trouble before.
It’s always good to be able to measure improvements, even if it takes 12 hours to take a measurement. At last we could push fixes and measure their impact. Plus, other parts of the projects weren’t ready to go to full speed, so we could live with this data sampled for a while longer.
Let’s do it
So we started to kill useless memory allocations. For the heavy ones, we created a few projects. Some were delegated to other teams (It’s not only our code running in our app). Some were started in our team.
For the rest, we dug old stories in our backlog, and relentlessly tackled them. While doing this, reducing memory allocations was on everyone’s mind and soon ideas popped out. Building lists with length preallocated, stop using strings everywhere, stop allocating objects in for loops when they could be allocated outside, caching this and that, preloading various things to ease the warmup issue. Every trooper was participating even the people not officially on those specific tasks. These were all obvious fixes that had been overlooked. Those pop up on a regular basis and sometimes they get through code review.
After a few fixes were in, the traffic was cut only for a while before stabilization.
For each little fix, we reduced the problem further and further. At every release we re-tested activating our feature and witnessed less and less time until everything was behaving…. in one datacenter. But not on the others. Not all requests are equal and from one country to the next, the repartition between different types of requests isn’t the same. So this wasn’t a big surprise.
True, we were basically shooting in the dark. The good thing is that the barn had only broad sides, and we were inside! No risk to miss. Even if we were troopers. Did I mention we are the Trooper’s team at Criteo? The team was named at a time when we were working on Storm. Oh well…

The Troopers Team at last year’s XMas party
(Yes, Darth Maul and Vader did coexist)
So we pushed more fixes and we got two more datacenters in range. A few more fixes later, all DCs were behaving.
At last! Everything started working from the get go. We could finally activate the feature at 100% with close to no impact on our servers. It would be foolish to stop there of course. There was a threshold and we still are very close to it, only just below. But the movement is initiated. A few projects will land in a few weeks from now, easing a little more the pressure we put on the GC. And the team is much more attentive to memory allocations than before.
Whew!
So we learned a few precious things while doing this. First, we refreshed our skills with WinDump and WinDbg. Not that we love using them, but they’re useful in a number of cases and it’s good to have them at the ready. A few resources helped us, such as the the WinDbg cheat sheet and the basics of investigating memory with WinDbg.
We also (re)learned to be cautious about memory. After working with a GC for a while, it almost feels as if allocating stuff is free. Because it’s not you doing the dirty work of deallocating. It’s not free by any stretch of the imagination. It might work fine for a time while being careless, but when it bites, the cost comes back all at once, and right in your face.
Finally, we re-launched an old and forgotten project to do automated performance tests that monitor CPU, memory and a few other things. It cost almost nothing and will automatically catch bad offenders before they make it to production.
But most of all, this did highlight one of the great things about Criteo. We’re lucky enough to have vast resources of varied talents. Everyone was eager to help and this mix made this investigation much less painful than it could have been.
So yes, kuddos and thanks to:
- William the Butcher, a talented software engineer. He has this thing about investigating weird stuff.
- Deafening Seb, staff software engineer in our SWAT team. He speaks LOUDLY ALL THE TIME. You should see him at the bar…
- BenD a senior software developer in a team that uses one of our worst offender. Once he gets a bone, he never lets it go.
- and of course the Troopers (my teammates). The best team. Seriously.
- and their dark lord (My boss). The best boss. (Can I get my raise now?)
- And to Romain The Tiger (My boss’s boss), for so relentlessly pushing me to write this.
-
Pierre Grimaud

Software Engineer, Engine team.
See Software Engineer roles

