
This post of the series shows how to easily listen to CLR events with the TraceEvent package.
Part 1: Replace .NET performance counters by CLR event tracing.
Introduction
In the previous post, you saw that the CLR is emitting traces that could (should?) replace the performance counters you are using to monitor your application and investigate when something goes wrong. The perfview tool that was demonstrated is built on top of the Microsoft.Diagnostics.Tracing.TraceEvent Nuget package and you should leverage it to build your own monitoring system. In addition, the Microsoft.Diagnostics.Tracing.TraceEvent.Samples Nuget package contains sample code to help you ramping up.
Manage an ETW session
Create a console application and add the TraceEvent Nuget package. Your project now contains a TraceEvent.ReadMe.txt and a more detailed _TraceEventProgrammersGuide.docx Word document. You should really take the time to read the latter: it describes the architecture in great details and helps understanding what is going on under the scene.

In the Main entry point, add the following code to list existing ETW sessions:
Like logman -ets command, this piece of code might be handy during debugging session. Why? Just because when you debug your code that creates an ETW session and if you stop the debugger before disposing it, the session becomes orphan and after a while, Windows simply refuses to create new ones. In addition to easily find your orphans sessions, another good reason to give a meaningful name to your session is to be able to stop it. Type the following command line: logman -ets stop <session name> to close a running session and clean up the mess your debugging sessions might have created. This is definitively better than rebooting the machine.
The next step is to create a session. You get a TraceEventSession object either by attaching to an existing session or by creating a new one as shown in this code:
Why is it necessary to run the code that manipulates the session in another thread with Task.Run? The call to the Process method is synchronous so it would not be possible to get the user input. When the user exits, the session is disposed and the Process method returns. If you close the session with logman, the Process method will also return. This behavior applies because the TraceEventSession.StopOnDispose property is set to true by default.
Note that if you want to use TraceEvent to parse an .etl file, you simply need to pass the filename as an additional parameter to the TraceEventSession constructor; the rest of the code will be the same.
The code running in the task first registers handlers to the events as you will soon see. Next, you need to enable the providers you are interested in receiving events from. In our case, only the ClrTraceEventParser.ProviderGuid CLR provider is enabled (read https://docs.microsoft.com/en-us/dotnet/framework/performance/clr-etw-providers for more details about the two available CLR providers). In addition to the verbosity level, you should set the keywords with the ClrTraceEventParser.Keywords enumeration values corresponding to the categories of events you want to receive
Additional filters such as which process to monitor can be set by passing TraceEventProviderOptions to the EnableProvider() method. But wait! On a Windows 7 machine this kind of filtering is not working and you get events from all processes… No specific documentation to look at… This is where knowing what Win32 APIs are called behind the scene could help. Instead of decompiling the TraceEvent assembly, you should instead take a look at its implementation… because it is open sourced with Perfview! The Microsoft documentation for the called EnableTraceEx2 function states that there are several types of scope filters that allow filtering based on the event ID, the process ID (PID), executable filename, the app ID, and the app package name. This feature is supported on Windows 8.1,Windows Server 2012 R2, and later. If you need to filter out events based on process id, don’t worry: each event will provide it.
Listen to CLR events
Now let’s detail how to manage these CLR traces. The TraceEventSession exposes an ETWTraceEventSource object via its Source property that is used to process the events.
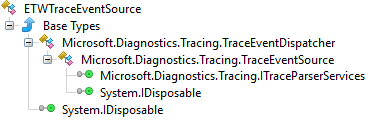
This class derives from TraceEventDispatcher that provides the Process method. The TraceEventSource ancestor class is where the event handlers can be registered on the following properties:

Behind the scene, each provider emits strongly typed traces that could be difficult to parse manually: don’t worry, the TraceEvent library does the job for you through dedicated parsers exposed by TraceEventSource.
In case of .NET events, you usually rely on the ClrTraceEventParser that exposes via .NET event the 100+ different traces emitted by the CLR ETW provider… plus one called All just in case you want to see all of them.
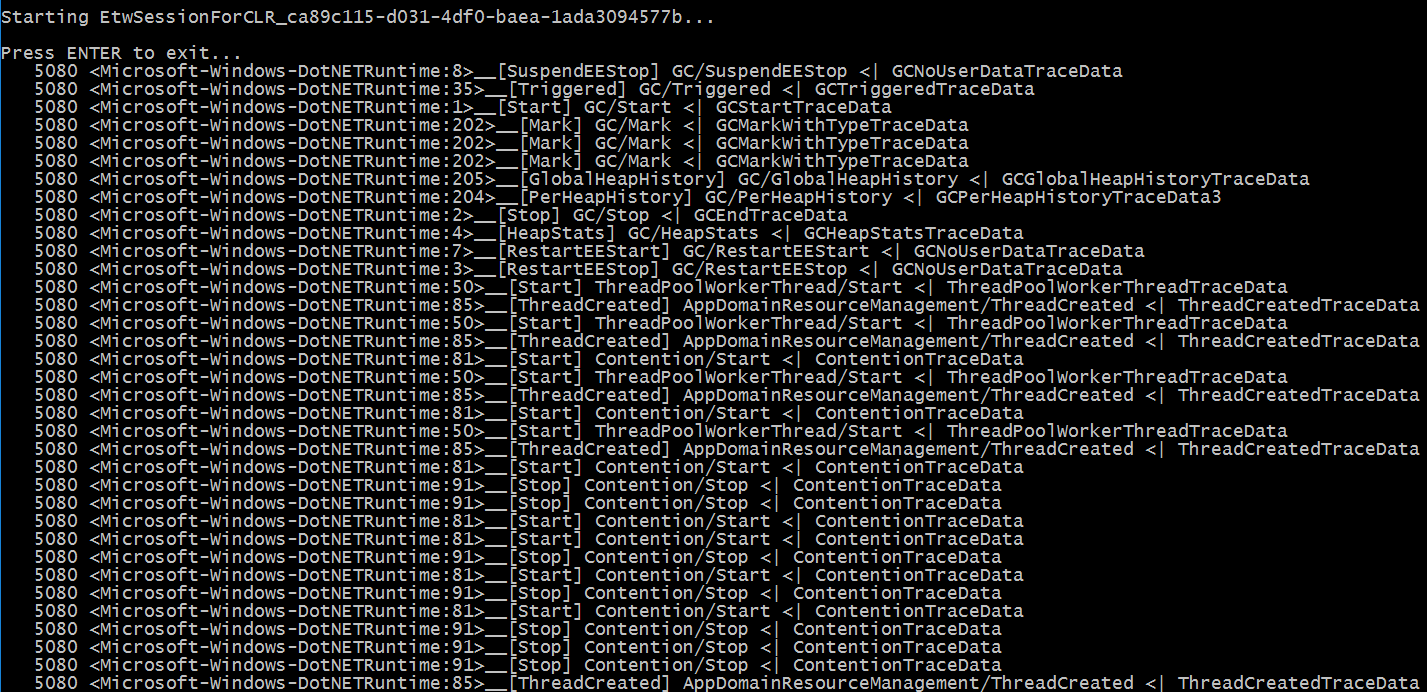
Here is the first naïve implementation to display all CLR traces as shown in the previous screenshot:
The SkipEvent method is here just for you to filter out traces… and this is very helpful to remove meaningless noise when you are beginning to work with CLR traces and you need to see which events are generated.
Each trace payload is received as a generic TraceEvent object that exposes common properties:
- ProcessID/ProcessName: information related to the process in which the trace has been emitted by the CLR
- ThreadID: numeric identifier of the thread from which the trace was sent
- ID: numeric identifier of the trace that helps you find the corresponding event in the Microsoft documentation (i.e. Event ID)
- OpcodeName: human readable name of the trace
- EventName: concatenation of task (= group such as “Contention” corresponding to the Keyword mentioned earlier) and OpcodeName separated by ‘/’
Based on the kind of trace, you get additional details stored in the TraceEvent-derived object received by the event handler. Note that the TraceEvent object is reused so you can’t keep the reference after the event handler returns: either call Clone on it or duplicate the fields you are interested in; which is I would recommend.
The actual payload of the event has been marshalled as byte[] that you don’t want to decipher, extracting by hand each field listed in the documentation. You could cast into the real type (given by data.GetType().Name in the All event handler) but the Clr TraceEventParser exposes one C# event per specific trace emitted by the CLR provider: you just have to register your event handler and get the details you need from the given argument.
But… what are the events to listen to?
Son, the next big step is to learn which events are interesting for you to monitor. I would suggest you read the rest of this post before going to the Microsoft documentation that describes all CLR events in details.
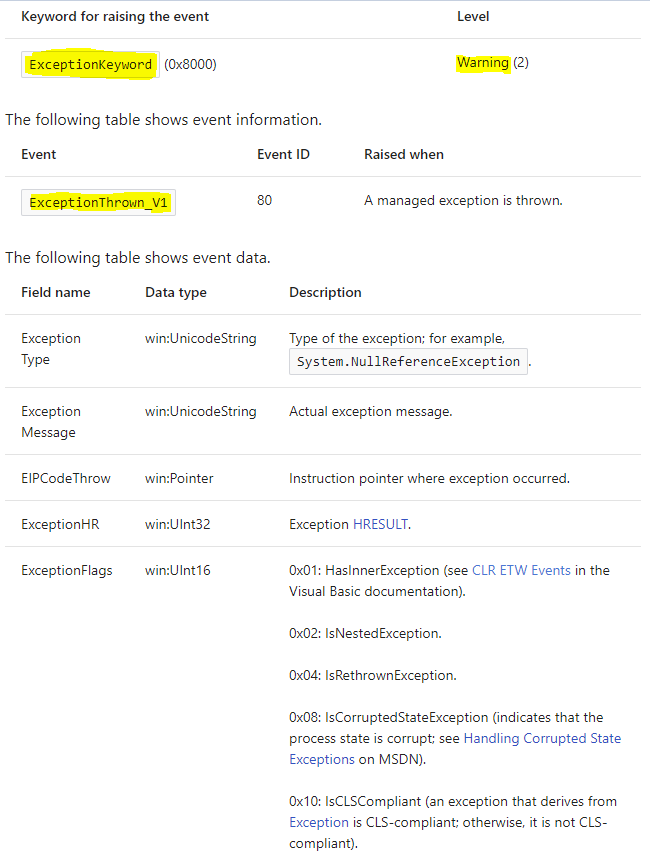
Let’s start with the simplest case: one trace is emitted when an exception is thrown. Microsoft documents the ExceptionThrown_V1 event with ExceptionKeyword and Warning verbosity level:
Unfortunately, there is no ExceptionThrown_V1 event at the ClrTraceEventParser level:
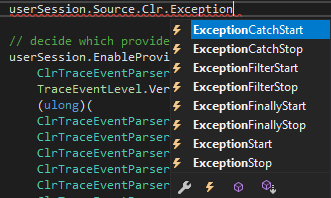
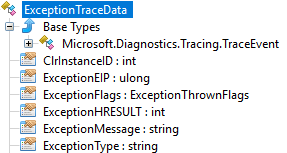
In fact, the ID property of the received traces maps the “Event ID” of the documentation so the ExceptionStart event happens to bring the same level of information as ExceptionThrown_V1 via the ExceptionTraceData parameter passed to the handler:
The corresponding handler implementation is straightforward:
The interesting properties are ExceptionType for the name of the thrown exception and ExceptionMessage for its message. Note that if the exception contains inner exceptions, you know it by taking a look at the ExceptionFlags property but you can’t access them. Remember that you should have received earlier the trace corresponding to the inner exception when it was thrown so you are just missing the relationship between the two.
If for an unknown reason the number of exceptions raises for one of your applications, listening to this event is a very cheap way to know which exceptions are thrown and search for them into the source code!
The next episode will detail other important CLR traces you need to monitor your applications and even start an investigation.
Post written by:
|
Christophe Nasarre Staff Software Engineer, R&D. Twitter: chnasarre |
Kevin Gosse Staff Software Engineer, R&D. Twitter: KooKiz |


-
CriteoLabs

Our lovely Community Manager / Event Manager is updating you about what's happening at Criteo Labs.
See DevOps Engineer roles

