
In part 1 and part 2, we’ve seen in detail how to customize the WinDBG UI as we see fit. This time, we’ll apply this knowledge to cover a very specific use-case: running C# code as script directly inside of WinDBG.
Why would you want to do that? If like us you often use ClrMD during your debugging investigations, you know how much time you lose switching back and forth between the dump in WinDBG and the ClrMD code in Visual Studio. How convenient would it be to be able to do everything without leaving WinDBG?
Well, we’re about to find out. For this to work, we need two components: the C# editor UI, and the engine to execute the code.
Step 1: The C# editor
it’s just a matter of creating a new tool window and you already know how to do that if you read the part 2 of the series. The UI is very simple: a ICSharpCode.AvalonEdit control to colorize your C# code and a Run button.
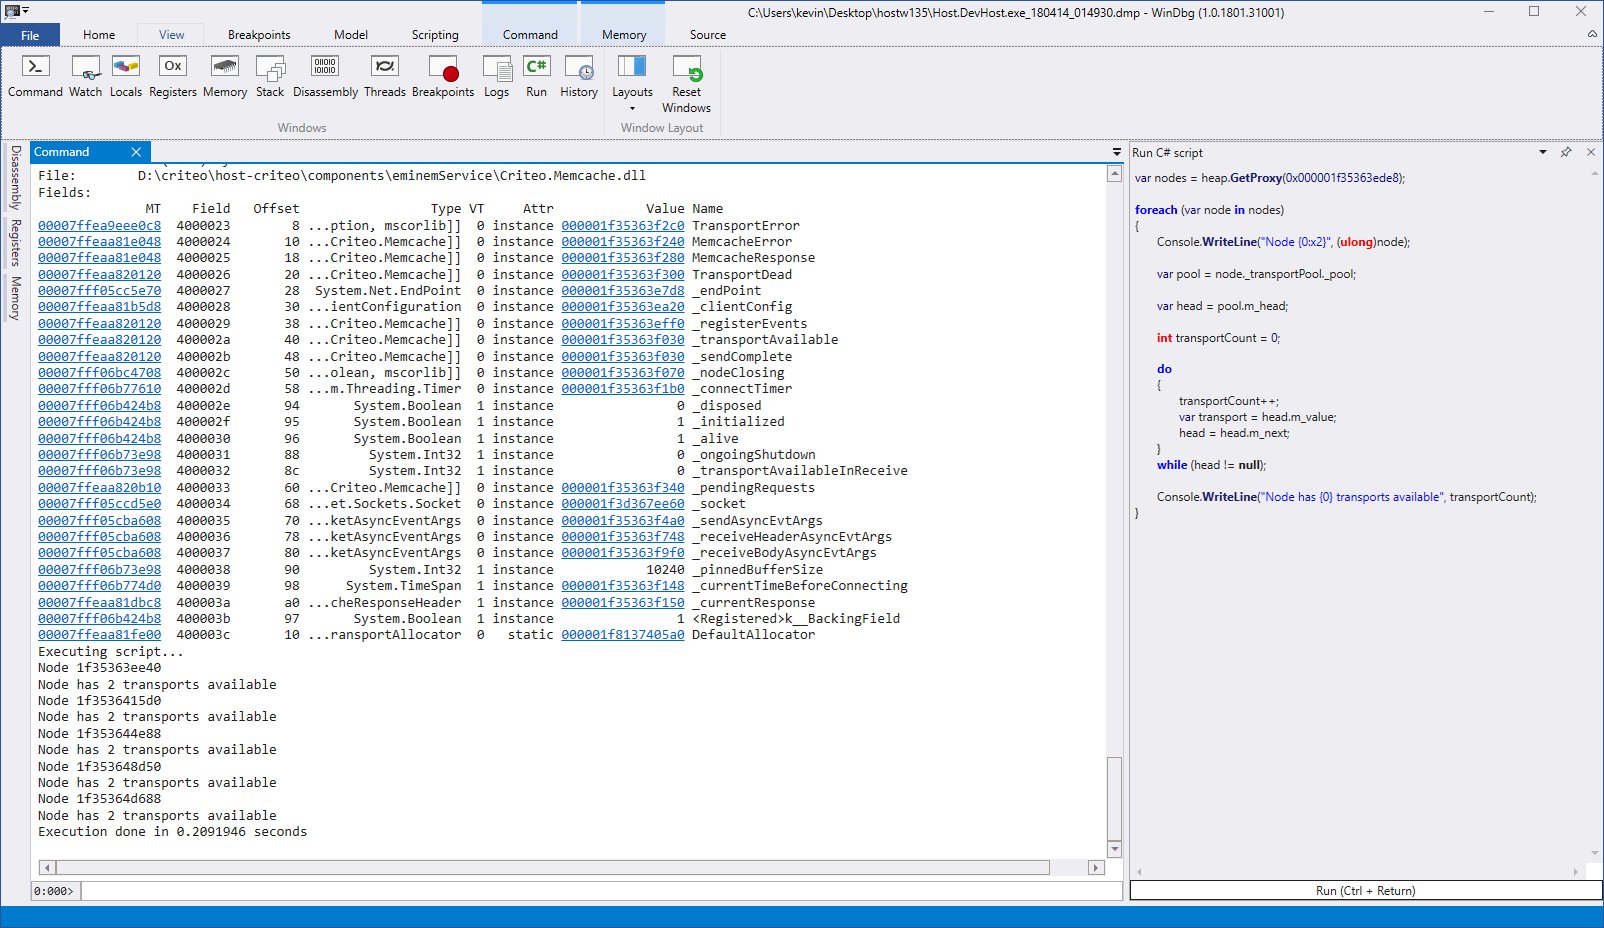
The question to answer to now is: what to do with the C# code typed in the editor? In Visual Studio, to leverage ClrMD, you would have written an entry point file that initializes a ClrRuntime for a given dump file and get the corresponding ClrHeap before starting to dig into the dump memory.
We are going to do almost the same here. As you can see from the previous screenshot, the code written in the C# editor has an implicit parameter named “heap“ corresponding to the ClrHeap of the memory dump. This is because it will be merged in the middle the following string that is saved into a temporary file:
WinDBG uses a multi-processes model, where the debugger engine runs in a separate process from the UI. Therefore, code running in the UI wouldn’t have access to the memory dump. We need a way to execute the C# code directly inside of the debugger engine process.
It will be the responsibility of a new WinDBG extension exporting a !compileandrun command that accepts the filename containing the code (more on this very soon):
At the end of the execution, we display the result to the console and delete the .cs file.
But for the command to work, we still need to load the extension. We’re going to do so when the user clicks on the button to open the tool window. Also, for simplicity sake, we hardcode the path to the extension containing the “!compileandrun” function.
Step 2: The trojan horse
We already know how to execute compiled C# code inside of the WinDBG debugging engine. Here, we’re going to write a classical WinDBG extension that takes a C# file as input, compiles it, and runs it.
The extension will export the command “!compileandrun” expected by the view:
This function loads the C# file from the given path, and compiles it using CSharpCodeProvider, providing references to ClrMD and DynaMD. We assume that those assemblies are located in the same folder as the extension.
Then, we retrieve the “static Run(ClrHeap heap)” method from the generated assembly and we call it.
Step 3: Profit!
That’s it! There’s still plenty of room for improvement: for instance, it would be nice to have a 32 and 64 bit version of the “!compileandrun” extension and load the right one dynamically. Or the C# editor could have autocompletion for the ClrMD functions. Those improvements are outside of the scope of this article, but will hopefully be implemented in the near future in this GitHub repository.
Post written by:
|
Christophe Nasarre Staff Software Engineer, R&D. |
Kevin Gosse Staff Software Engineer, R&D. Twitter: KooKiz |


-
CriteoLabs

Our lovely Community Manager / Event Manager is updating you about what's happening at Criteo Labs.
See DevOps Engineer roles

