
On Windows, performance counters are the building blocks of most monitoring dashboards. When you need to corelate one counter with another counter, what could possibly go wrong?
Let’s take an example: you have two instances of an application running such as two worker processes w3wp.exe spawned by IIS to run your application and you need to monitor their health with performance counters. For this post, I’m using a simple .NET application called EventTracing.Simulator that will generate and catch exceptions or allocate a bunch of memory. When you start two instances of an application, they are identified in Performance Monitor by their process name and the #1 suffix for the second one.
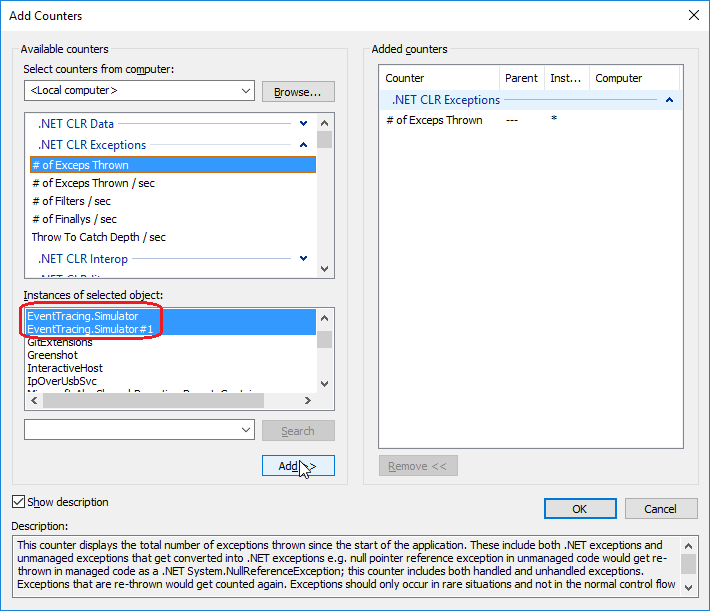
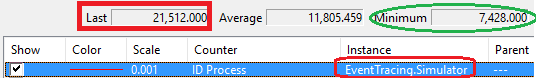
The same naming rule applies when you write code to get the values of the performance counters. If you want to map these app/app#1 to process ID, you can use the “Process\ID Process” performance counter and see the value of the PID of each process in the Last/Average/Minimum fields:
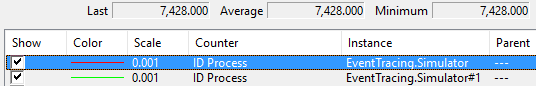
Same for the second process:

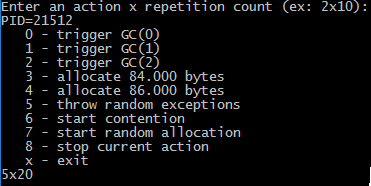
This is consistent with what my application basic UI shows, 7428 for the first instance and 21512 for the second one:

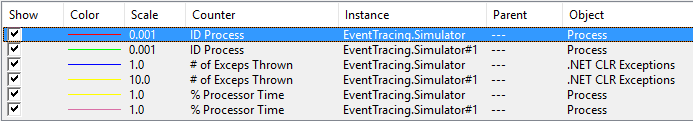
In addition to the process ID, also add the number of first chance .NET exceptions and CPU usage to Performance Monitor:
No magic… yet.
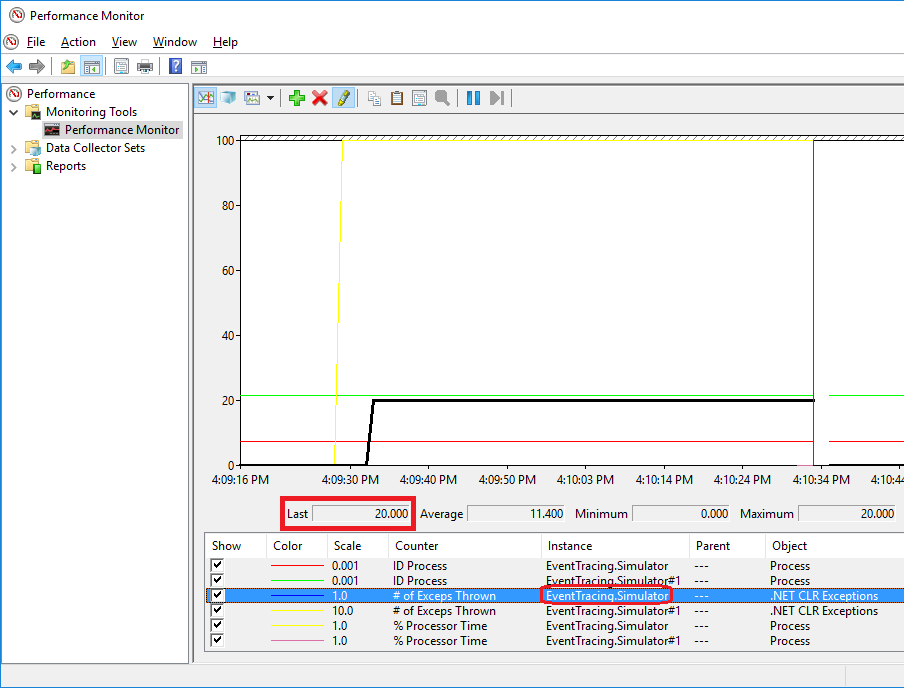
It is now time to ask the two applications to generate first chance exceptions: 10 for PID=7428 and 20 for PID=21512(#1). Let’s see what Performance Monitor shows for the instance without suffix :
and for the #1 instance:
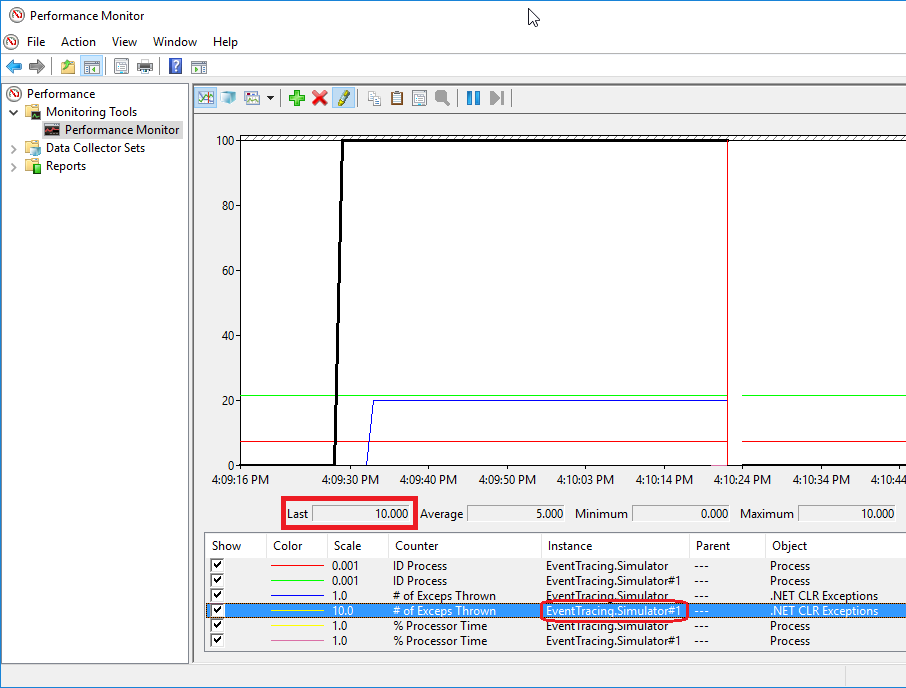
Wait… the app/app#1 identifiers can’t be used to identify the processes between counters!
If you try the same kind of exercise with CPU usage, the results are different: this time, the app/app#1 are pointing to the same process. Well… this is partially true.
Let’s select the CPU usage of the second application (PID = 21512 and #1)
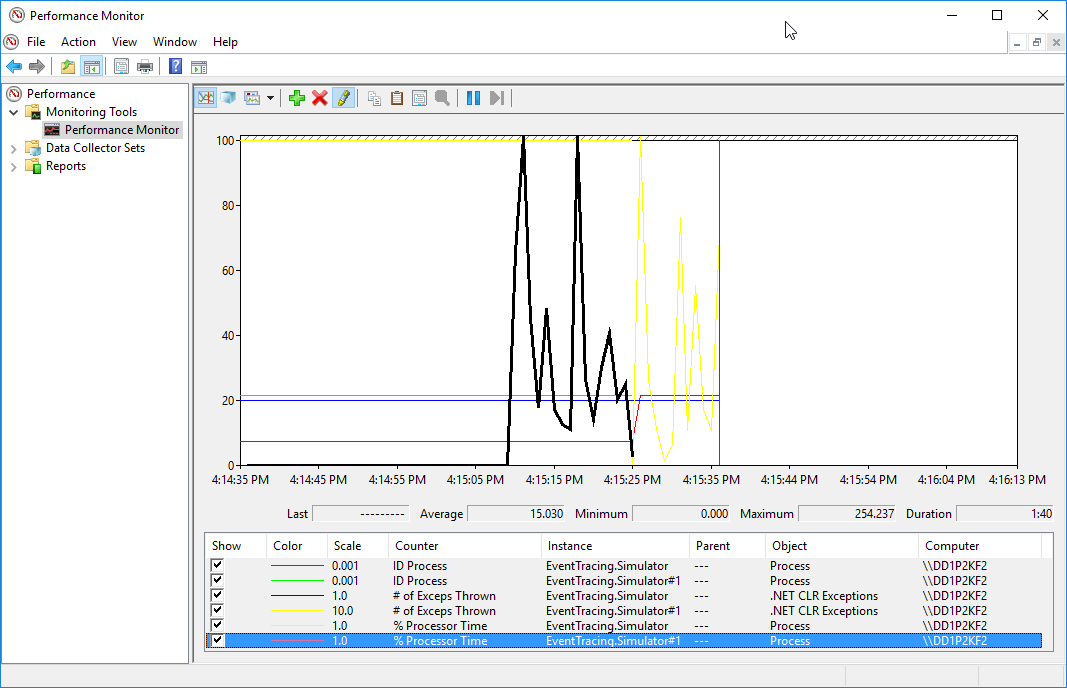
It starts to generate a lot of memory, triggering a visible CPU usage. At one point in time (4:15:25 PM here), the first application exits. This is where the real magic happens: Windows automagically changes the processes our performance counters are referring to!
Yes. You’ve read well: the #1 no more exists for Performance Monitor and the one without # suffix is now referring to PID=21512 as the yellow graph shows. If you look at the process ID counter for the application instance without # suffix, you see that it is now 21512:
and it was once PID=7428.
This is the most visible weird behavior of performance counters but there are more when you look at .NET applications. Even though you can bind a process ID for “.NET CLR Memory” counters thanks to its own “Process ID” counter, this is not the case for the other categories of counters: forget about correlation between applications…
A new series of post will be dedicated to possible replacement of performance counters for .NET developers by much more accurate details provided by the CLR via Event Tracing for Windows a.k.a. ETW.
Post written by:
|
Christophe Nasarre Staff Software Engineer, R&D. |
Kevin Gosse Staff Software Engineer, R&D. Twitter: KooKiz |


-
CriteoLabs

Our lovely Community Manager / Event Manager is updating you about what's happening at Criteo Labs.
See DevOps Engineer roles

