For the second year in a row, some people from our SRE team attended the Monitorama conference this past June . Hosted in Portland downtown, the conference run for 3 days at the Gerding Theater at the Armory for 3 days with very insightful talks about Monitoring.

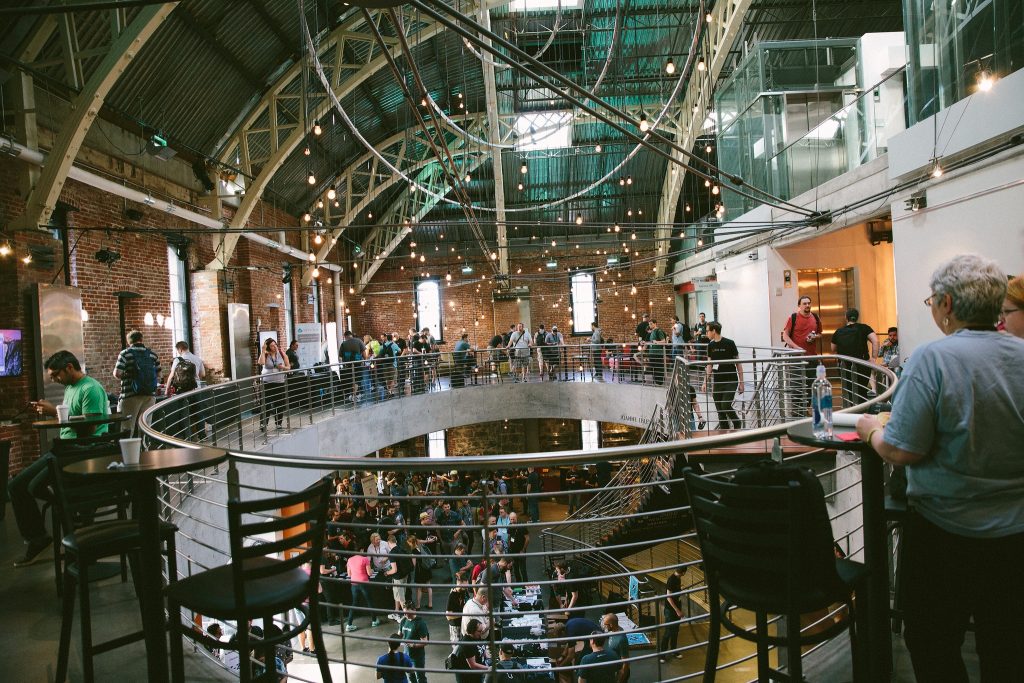
Entrance hall of the Gerding Theater at the Armory – Copyright Jason Dixon under the CC-BY-SA 2.0 license
Monitorama started back in 2013, with the first event being held in Boston. At that time, the founder, Jason Dixon, decided that it was enough with #monitoringsucks and that we’d rather share some #monitoringlove instead with talented and passionate people in the monitoring field. Coincidentally, many Monitoring-centric communities, tools and companies have evolved and emerged in the 2010s, striving to make the monitoring land a better place.
This year, the event attracted about 600 attendees who originated from all around the world, and featured a very diverse set of speakers and partners.

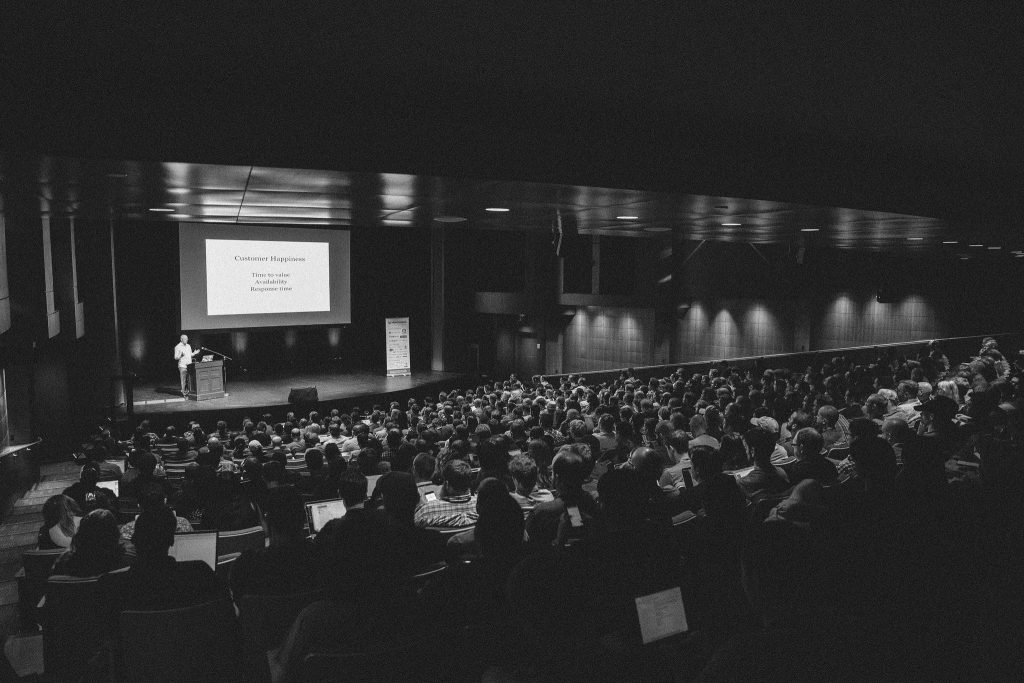
Interior of the Gerding Theater at the Armory – Copyright Jason Dixon under the CC-BY-SA 2.0 license
The major themes at the Monitorama 2016 were observability, on call and measurement.
The talks were very diverse in their form and content, some were very theoretical by giving advices and best practices while others were much more practical and gave real-life feedbacks.
The importance of Monitoring at Criteo R&D
At Criteo, we run software on our own systems with self-hosted bare metal servers. We have close to 20000 of those servers across 7 datacenters in the world, which run under Windows or Linux environments. They embed a wide variety of applications written in many languages. On our main monitoring platform, we currently have more than 200000 services and 30000 hosts (due to all other devices) being actively checked every few minutes or so. Of course, we do regular ramp-ups to handle the increasing load due to natural growth or new projects, increasing these numbers by hundreds each time.
This is just the tip of the iceberg, because it’s not only about single machines and applications when we manage our whole infrastructure stack, but it’s also about clusters, network, power consumption, resource usage, hardware failures and so on. Having so many different things to handle everyday means that we must have a proper monitoring. It must be present at every level of our stack to ensure a continuous good quality of service.
After all, we couldn’t successfully run the Europe’s largest Hadoop cluster with 1800 nodes if we weren’t capable of detecting issues as soon as possible and fix them in a timely manner!
Millions of log lines and metrics are generated each minute by our applications and then put in time-series databases or big data storages to be ingested and visualized later. It helps us a lot to have a clear overview of the platform health.
Noticeable talks
During those three awesome days, some talks were particularly remarkable in their content, so here is a quick summary of five of them (which also happen to be the first talks of the event):
Monitoring Challenges – Adrian Cockcroft
It was the very first talk given at this year’s Monitorama, and a very interesting one.
A first thing note is that your monitoring systems shouldn’t die first when things go wrong. Put another way, you shouldn’t setup them on the same location (physical or virtual) than the rest of the infrastructure you need to monitor.
The Monitoring in general is here to measure your business value: customer happiness (time to value, availability…), cost efficiency (resource usage, optimization, automation…) and so on.
The IT world is moving fast, so the monitoring needs and systems evolve constantly.
As the cost per node drops drastically nowadays thanks to democratized virtualization and containerization technologies, Monitoring becomes more affordable and shouldn’t be neglected because of budget issues.
Monitoring is Dead. Long Live Monitoring – Greg Poirier
Monitoring is traditionally about checking resource usage (CPU, RAM, disks), process or network aliveness (service status, ping, port check). We estimate thresholds based on our experience and the way the systems usually behave to differentiate between the 3 main states that we still use today: OK, Warning, KO. Even if we now have fancier tools like TSDBs, derivatives or percentiles, we still tend to take a single metric in isolation and do assertions about it. We used to do our monitoring the same way that we wrote tests for our software: it’s either true or false.
To improve monitoring, we need a better understanding of our systems behaviors. In order to so, it must be part of the software development process. We can also put in place some better health checks that monitor the system as whole, not single components. This is especially true for distributed systems which require events correlation to avoid meaningless isolated warnings.
In short, the more we understand our system, the better our monitoring will be.
How metrics shape your culture – Nicole Forsgren
In that talk it is explained how metrics are key components of the engineering culture. Building such a thing is part of the innovation process, because you can’t improve what you don’t measure. However, just because something is hard to measure doesn’t mean it’s worth measuring, so you should ask to yourself and the others what is the value of the metric you want to use. Remember that having a data driven culture is a communication enabler, see the Data Driven book written by Hilary Mason and DJ Patil.
Creating a culture of observability at Stripe – Cory Watson
The main point of this talk is that choosing tools for a good monitoring solution isn’t necessary the key, but their usage and users are. You build a monitoring solution to answer the needs of your customers (should they be internal or external), so their opinions and feedbacks are very important. It has to be noted that some trusted power users should be identified from the beginning, they will help guiding the project in the right direction. So, you should start small, seek feedback, think on your value, measure effectiveness and finally enjoy the result !
Healthz: Stop reverse engineering applications and start monitoring from the inside – Kelsey Hightower
The message of the speaker is basically to think backwards. Too often we add monitoring at the end of a project, when the app is already designed and implemented. Instead of this, he suggests to embed a submodule inside the application to expose key metrics. They will give a clear health status from the outside. This way, the health check based on those metrics can be deployed along with the application. Food for thought: keep monitoring at heart of the application and think about it from the start.
Many other talks were very interesting in both their form and content, so you should definitely check out the talk recordings.
Can I go even if I’m not a monitoring expert ?
Of course you can, and you should! This event is also the occasion to meet talented and passionate people in the monitoring domain, should it be for engineering culture or professional partnerships.
There are various external events related to Monitorama traditionally happening on the second day which gives anyone the opportunity to grab a beer and talk about anything (related to monitoring of course!) with people of interest.
In our case, we met (among others) some people behind Grafana ( Raintank), Graphite and Prometheus (Robust Perception) as we are already using those tools on a daily basis.
It gave us the occasion to talk about some ongoing projects (like biggraphite) and pending issues or requests, which resulted into promises of near-future collaboration.
If you have to remember one thing, remember this: Monitoring (with a big M) should be everyone’s concern. To quote Dave Josephsen from a talk he gave at the Monitorama, “nobody owns monitoring, because measuring things is everyone’s job“. Should you work on developing software, setting up or maintaining an IT infrastructure, you’ll always want to know what’s going on with your applications or systems. It’s never too late to hop on the monitoring train, some come on in !
Links
- Monitorama official website
- All the Monitorama 2016 talks with captions
- Pictures taken during the event by Jason Dixon
- Share the monitoring love on your laptop!
Post written by:
-
CriteoLabs

Our lovely Community Manager / Event Manager is updating you about what's happening at Criteo Labs.
See DevOps Engineer roles


