
At Criteo, we have hundreds of machine learning models that we re-train several times a day on our Hadoop cluster. Until last year, we were training our models using MapReduce jobs. Since the learning is iterative and thus slow in pure MapReduce, we were using a custom implementation called AllReduce. With Spark gaining traction, we saw the opportunity to get rid of this custom code by migrating to an open-source solution. Moreover, AllReduce was inhibiting the MapReduce fault-tolerance mechanism and this prevented us to scale our models further.
During this migration, we gained a deeper understanding of Spark, notably how to diagnose and fix memory errors. Since those are a common pain point in Spark, we decided to share our experience. In this blog post, we will focus on java out of heap error (OOM).
We first highlight our methodology and then present two analysis of OOM errors we had in production and how we fixed them.
How to analyse out of memory errors in Spark
If you work with Spark you have probably seen this line in the logs while investigating a failing job.
Your first reaction might be to increase the heap size until it works. It can be enough but sometimes you would rather understand what is really happening. Just as for any bug, try to follow these steps:
Make the system reproducible. Since Spark jobs can be very long, try to reproduce the error on a smaller dataset to shorten the debugging loop.
Make the system observable. Enable Spark logging and all the metrics, and configure JVM verbose Garbage Collector (GC) logging.
Use the scientific method. Understand the system, make hypothesis, test them and keep a record of the observations made.
Now let’s look at the details!
Case 1: Smaller partitions saved our job
A surprising OOM
We first encountered OOM errors after migrating a pre-processing job to Spark. This job consists of 3 steps:
- Read data from HDFS, transform each element and persist the RDD on disk
- Compute aggregated statistics (like the number of elements)
- Write the transformed elements on HDFS
Since our dataset is huge, we cannot load it fully in memory. So, the job is designed to stream data from disk and should not consume memory. Thus it is quite surprising that this job is failing with OOM errors.
First, we check the basics:
- How much java heap do we allocate (using the parameter spark.executor.memory) and what is the share usable by our tasks (controlled by the parameter spark.memory.fraction). For more details, see Spark documention on memory management.
- Looking at the logs does not reveal anything obvious. On the driver, we can see task failures but no indication of OOM. On the executors, the stacktrace linked to the out of memory exception is not helping, as you can see below.
We tried reproducing the error on smaller jobs keeping the ratio of total dataset size to number of executors constant (i.e. weak scaling) without success.
Our best hypothesis is that we have a memory leak. So we decided to plot the memory consumption of our executors and check if it is increasing over time. It is not the case (see metrics below).
However we notice in the executor logs the message ‘Found block rdd_XXX remotely’ around the time memory consumption is spiking. Our issue seems to be related to remote blocks. Let’s dig deeper into those.
Committed memory is the memory allocated by the JVM for the heap and usage/used memory is the part of the heap that is currently in use by your objects (see jvm memory usage for details). In this case, the memory allocated for the heap is already at its maximum value (16GB) and about half of it is free.
Remote blocks and locality management in Spark
Since this log message is our only lead, we decided to explore Spark’s source code and found out what triggers this message. It appears when an executor is assigned a task whose input (the corresponding RDD partition or block) is not stored locally (see the Spark BlockManager code). In that case, just before starting the task, the executor will fetch the block from a remote executor where the block is present. This block is then materialized fully in memory in the heap until the task is completed. Thus, to avoid the OOM error, we should just size our heap so that the remote blocks can fit. Since we have 12 concurrent tasks per container, the java heap size should be at least 12 times the maximum partition size. However, it is too much memory to ask for.
But why is Spark executing tasks remotely? Could we not simply execute tasks on the executors where the input partition is stored? In fact, it is exactly what the Spark scheduler is doing. When an executor is idle, the scheduler will first try to assign a task local to that executor. If none is available and sufficient time has passed, it will assign a remote task (parameter spark.locality.wait, default is 3s).
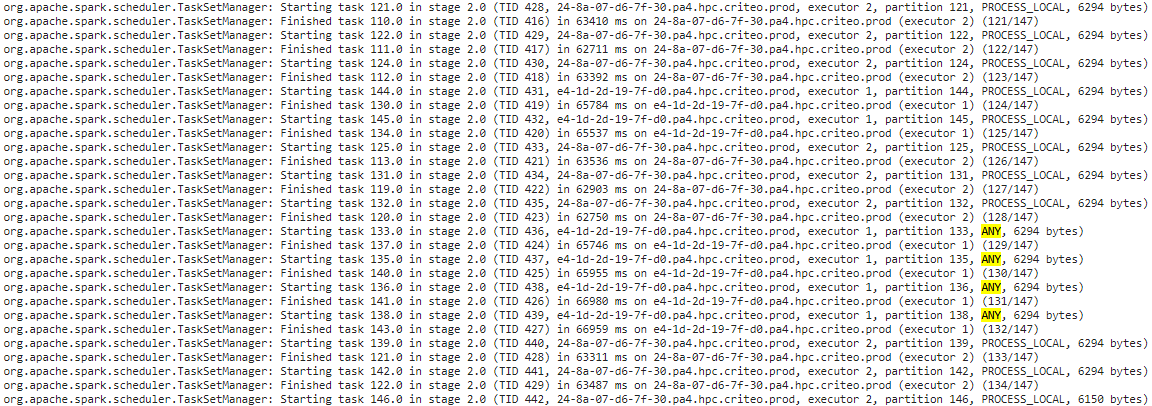
So what would explain the many remote tasks found at the end of a stage (see for example the driver log below)? If the processing time of local tasks is not properly balanced between executors, an executor with less load will be assigned many remote tasks when all its local tasks are done. This will allocate a large amount of heap to store all the remote blocks and the executor will fail.
Raising spark.locality.wait might work but should be high enough to cover the imbalance between executors. Moreover, this would waste a lot of resources. A better solution is to decrease the size of the partitions.
MapReduce InputFormat and RDD Partition Size
When creating a RDD from a file in HDFS (SparkContext.hadoopRDD), the number and size of partitions is determined by the input format (FileInputFormat source code) through the getSplits method. To limit the size of a partition, we set the parameter mapreduce.input.fileinputformat.split.maxsize to 100MB in the job configuration. Since one remote block per concurrent task could now fit in the heap of the executor, we should not experience OOM errors anymore. However, it is not the case and we can see in the Spark UI that the partition size is not respecting the limit.
After some researches on the input format we are using (CombineFileInputFormat source code) and we notice that the maxsize parameter is not properly enforced. This input format is coming from our previous MapReduce implementation, where it is useful to merge several small files together in the same split to amortize the overhead of mapper creation. This is not needed in Spark so we could switch to FileInputFormat which properly enforces the max partition size. This is what we did, and finally our job is running without any OOM!
Fixed in Spark
Since our investigation (see this bug report), a fix has been proposed to avoid allocating large remote blocks on the heap. This feature can be enabled since Spark 2.3 using the parameter spark.maxRemoteBlockSizeFetchToMem.
Case 2: Splitting the humongous objects
The GC stealing our memory
Compared to the previous case, we are now dealing with a more complex job, with several iterations including shuffle steps. Once again, we have the same apparent problem: executors randomly crashing with ‘java.lang.OutOfMemoryError: Java heap space’…
After initial analysis, we observe the following:
- The crash always happen during the allocation of a large double array (256MB).
- The Spark metrics indicate that plenty of memory is available at crash time: at least 8GB out of a heap of 16GB in our case.
How is that even possible? We are not allocating 8GB of memory without noticing; there must be a bug in the JVM! Let’s make an experiment to sort this out. Our JVM is configured with G1 garbage collection. What happens if we use parallel GC instead? Well, no more crashes! There is a small drawback though: 20% of the time is spent doing garbage collection (up from only a few percent)… but still it is a strong hint.
So there is a bug in the JVM, right? Well of course not! Blaming the JVM (or the compiler, or the OS, or cosmic radiation) is not usually a winning strategy.
Humongous fragmentation
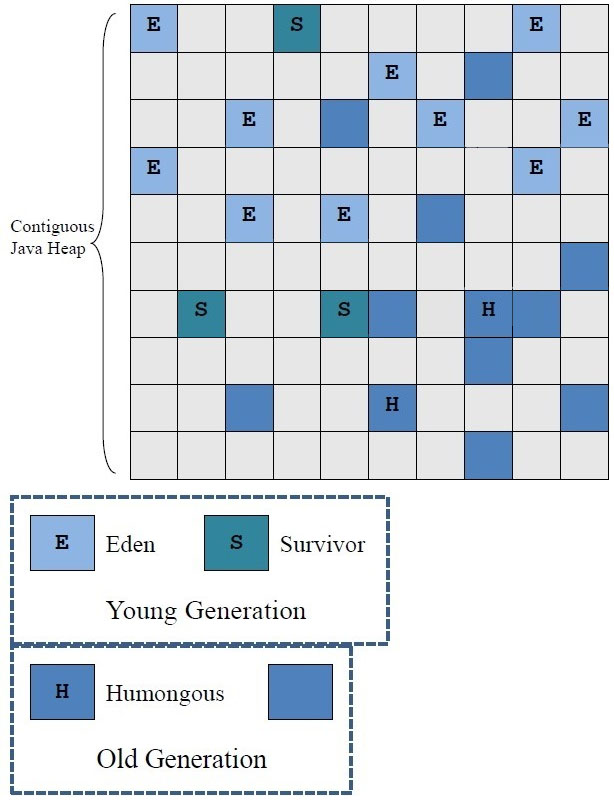
- G1 partitions its memory in small chunks called regions (4MB in our case).
- When allocating an object larger than 50% of G1’s region size, the JVM switches from normal allocation to humongous allocation. This process requires contiguous free regions.
- There is no process to gather free regions into a large contiguous free space. Even a full GC does not defragment.
We now believe that our free space is fragmented. Even if 8GB of the heap is free, we get an OOM because we do not have 256MB of contiguous free space. Let’s now increase the verbosity of the GC logs to make sure. We use the following flags:
We can see how each region is used at crash time. Each line of the log corresponds to one region and humongous regions have type HUMS or HUMC (HUMS marks the beginning of a contiguous allocation). The file is rather large, but with an ad hoc bash script, we are able to confirm that no 256MB contiguous free space exists.
Working around the GC
We now understand the cause of these OOM errors. We have a solution (use parallel GC instead of G1) but we are not satisfied with its performance. We also discarded the following ideas:
- Increase the G1 region size. The GC tries hard to create completely free regions, so setting their size to 256MB would ensure sufficient contiguous free space. However, the maximum region size is 32MB.
- Tune other GC parameters to perform GC collections more frequently and hope the heap is less fragmented. It seems very fragile.
Others in the community encountered this fragmentation issue with G1GC (see this Spark summit presentation), so this is probably something to remember.
Sum-up
It was harder than we thought but we succeeded in migrating our jobs from MapReduce to Spark. The processing is faster, more reliable and we got rid of plenty of custom code! Even though we found out exactly what was causing these OOM errors, the investigation was not straightforward. Better debugging tools would have made it easier. The infrastructure is already available in Spark (SparkUI, Spark metrics) but we needed a lot of configuration and custom tools on top to get a workable solution. Moreover, it takes hours at our scale between the end of a job and its display in the Spark History. This significantly slows down the debugging process.
If you felt excited while reading this post, good news we are hiring! Take a look at our job postings.
Post written by:
|
Fanny Riols Software Engineer, R&D-Engine |
Pierre Maury Staff Software Engineer, R&D – Engine |
Marc Tchiboukdjian Senior Software Engineer, R&D – Engine |


-
CriteoLabs

Our lovely Community Manager / Event Manager is updating you about what's happening at Criteo Labs.
See DevOps Engineer roles

